Water Data
| DAILY AVERAGE for MONTH | Lake Pump Hours | Treatment Meter Gallons | Liters daily per capita | Wall St Pump Hours | |||
| May 2026 | 14.9 | 82,256 | 655 | 1.6 | |||
| Apr 2026 | 10.9 | 62,442 | 498 | 1.4 | |||
| Mar 2026 | 10.8 | 59,829 | 459 | 1.1 | |||
| Feb 2026 | 10.0 | 55,297 | 441 | 1.2 | |||
| Jan 2026 | 11.9 | 59,026 | 470 | 1.1 | |||
| Dec 2025 | 11.3 | 59,697 | 476 | 1.0 | |||
| Nov 2025 | 12.5 | 62,114 | 495 | 1.1 | |||
| Oct 2025 | 11.7 | 58,321 | 465 | 1.2 | |||
| Sep 2025 | 14.5 | 74,511 | 594 | 1.4*** | |||
| Aug 2025 | 17.1 | 91,293 | 727 | 5.8 | |||
| Jul 2025 | 17.8 | 109,844 | 875 | 6.0 | |||
| Jun 2025 | 12.9 | 83,061 | 662 | 5.3 | |||
| May 2025 | 11.4 | 67,936 | 541 | 4.4 | |||
| Apr 2025 | 12.9 | 71,339 | 549 | 4.2 | |||
| Mar 2025 | 12.3 | 75,075 | 598 | 3.9 | |||
| Feb 2025 | 19.6 | 142,664 | 1,137 | 5.8 | |||
| Jan 2025 | 18.9 | 139,858 | 1,114 | 4.5 | |||
| Dec 2024 | 19.5 | 144,127 | 1,145 | 4.5 | |||
| Nov 2024 | 19.3 | 136,793 | 1,096 | 4.4 | |||
| Oct 2024 | 17.8 | 132,646 | 1,054 | 5.2 | |||
| Sep 2024 | 18.1 | 133,852 | 1,068 | 4.6 | |||
| Aug 2024 | 18.2 | 139,106 | 1,110 | 4.5 | |||
| Jul 2024 | 18.7 | 139,348 | 1,111 | 4.8 | |||
| Jun 2024 | 17.4 | 127,194 | 1,011 | 3.9 | |||
| May 2024 | 17.4 | 122,764 | 985 | 3.9 | |||
| Apr 2024 | 16.0 | 108,730 | 864 | 4.0 | |||
| Mar 2024 | 15.1 | 102,977 | 818 | 4.2 | |||
| Feb 2024 | 15.4 | 95,262 | 752 | 4.2 | |||
| Jan 2024 | 17.2 | 106,480 | 852 | 4.1 | |||
| Dec 2023 | 11.7 | 71,892 | 565 | 3.9 | |||
| Nov 2023 | 12.2 | 72,726 | 577 | 4.1 | |||
| Oct 2023 | 12.2 | 72,335 | 575 | 3.8 | |||
| Sep 2023 | 13.3 | 73,910 | 587 | 4.3 | |||
| Aug 2023 | 16.7 | 93,148 | 734 | 4.5 | |||
| Jul 2023 | 17.3 | 101,852 | 809 | 5.6 | |||
| Jun 2023 | 16.5 | 100,905 | 804 | 4.6 | |||
| May 2023** | 15.5 | 82,857 | 674 | 3.8 | |||
| Apr 2023 | 14.7 | 67,995 | 542 | 3.3 | |||
| Mar 2023* | 12.7 | 70,614 | 563 | 3.4 | |||
| Feb 2023 | 11.8 | 74,965 | 597 | 3.1 | |||
| Jan 2023 | 12.9 | 79,243 | 631 | 3.0 | |||
| Dec 2022 | 13.7 | 91,955 | 733 | 3.9 | |||
| Nov 2022 | 12.6 | 78,307 | 624 | 3.4 | |||
| Oct 2022 | 12.2 | 76,617 | 611 | 4.9 | |||
| Sep 2022 | 14.3 | 90,634 | 722 | 4.7 | |||
| Aug 2022 | 16.5 | 109,693 | 850 | 4.7 | |||
| Jul 2022 | 15.0 | 96,437 | 768 | 4.8 | |||
| Jun 2022 | 13.7 | 87,618 | 698 | 4.0 | |||
| May 2022 | 12.3 | 81,258 | 651 | 4.1 | |||
| Apr 2022 | 17.4 | 115,354 | 920 | 3.6 | |||
| Mar 2022 | 16.6 | 111,384 | 868 | 3.4 | |||
| Feb 2022 | 18.9 | 123,284 | 999 | 3.6 | |||
| Jan 2022 | 20.0 | 139,891 | 1,115 | 3.9 | |||
| Dec 2021 | 15.3 | 103,364 | 824 | 3.9 | |||
| Nov 2021 | 14.0 | 88,698 | 707 | 4.2 | |||
| Oct 2021 | 12.2 | 76,570 | 610 | 3.6 | |||
| Sep 2021 | 12.1 | 78,152 | 623 | 4.2 | |||
| Aug 2021 | 18.4 | 123,708 | 986 | 5.8 | |||
| Jul 2021 | 19.0 | 132,428 | 1,055 | 5.8 | |||
| Jun 2021 | 18.9 | 125,751 | 1,002 | 5.3 | |||
| May 2021 | 18.3 | 116,600 | 929 | 6.7 | |||
| Apr 2021 | 15.7 | 102,425 | 816 | 6.0 | |||
| Mar 2021 | 17.2 | 87,479 | 697 | 5.0 | |||
| Feb 2021 | 20.6 | 145,299 | 1,158 | 5.1 | |||
| Jan 2021 | 19.0 | 114,826 | 915 | 4.1 |
*WTP flow decreased Mar 15 2023. This increases pump hours per volume.
**WTP flow increased May 15 2023. This decreases pump hours per volume.
*** New pressure tanks at pumphouse
Drawdown times
The graph below gives an idea of the leak situation.. Shown is how long the pump is off for the longest period of time each day. Usually this is during the night, and sometimes in the afternoon.
These times indicate how long it takes for the tank level to drop from the high level sensor (when the pump stops), to the low level sensor (when the pump starts again). During times assumed to have very little water use by residents, the tank water level dropping can be assumed to be due to leakage or waste – either in the mains or on private property.
Longer times indicate less leakage.
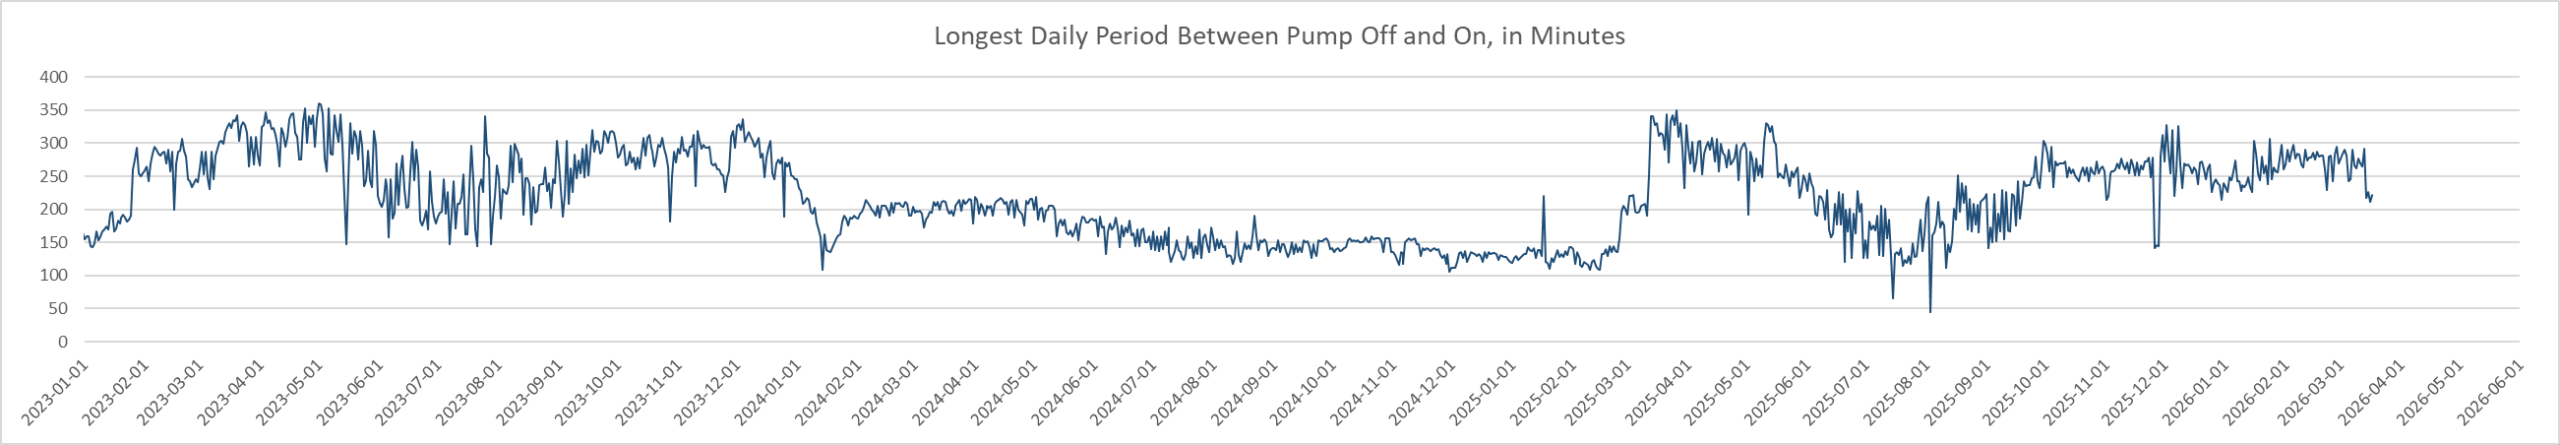
Drawdown data is best used as a comparative indicator, not a precise measurement.
Because the exact volume between level sensors cannot be measured accurately, drawdown is used to identify trends and changes over time rather than to calculate exact water volumes.